In this post, we’ll cover 10 tools that are useful for every SRE in the modern era. We’ve selected these tools based on their popularity, ease of use, functionality, and how well they fit in with the modern SRE’s toolkit.
SREs are in charge of the everyday operations of their organization’s technology. They are often tasked with keeping IT systems operational in spite of the shortcomings of human performance, and this gets more difficult with time. This is why it is important that SREs have the right tools to do their jobs. The right tools will make their jobs easier, and will help them manage their tasks more efficiently. This blog will look at the top 10 SRE tools that every SRE should have.
Application performance monitoring (APM) tools
Application performance monitoring (APM) tools are software that monitors the performance of applications. This is important because it helps to identify when the application is not performing as expected and can help to fix the issue quickly. APM tools can be used to identify bottlenecks, monitor system resources, identify slow SQL queries, and monitor for memory leaks.
DataDog
Datadog is a monitoring service for servers and applications. It provides metrics, graphs, and alerts for your applications and servers, so you can keep track of their health. Datadog also offers integration with other services such as Slack, Google Analytics, and Amazon Web Services.
Kibana
Kibana is a free and open source data visualization tool that is designed to visualize large amounts of time-series data. It is a framework that is used to create dashboards, reports, and alerts. The software provides the user with a variety of ways to display data and includes features such as: table editor, chart builder, filtering, sorting, drill-down capabilities, and more.
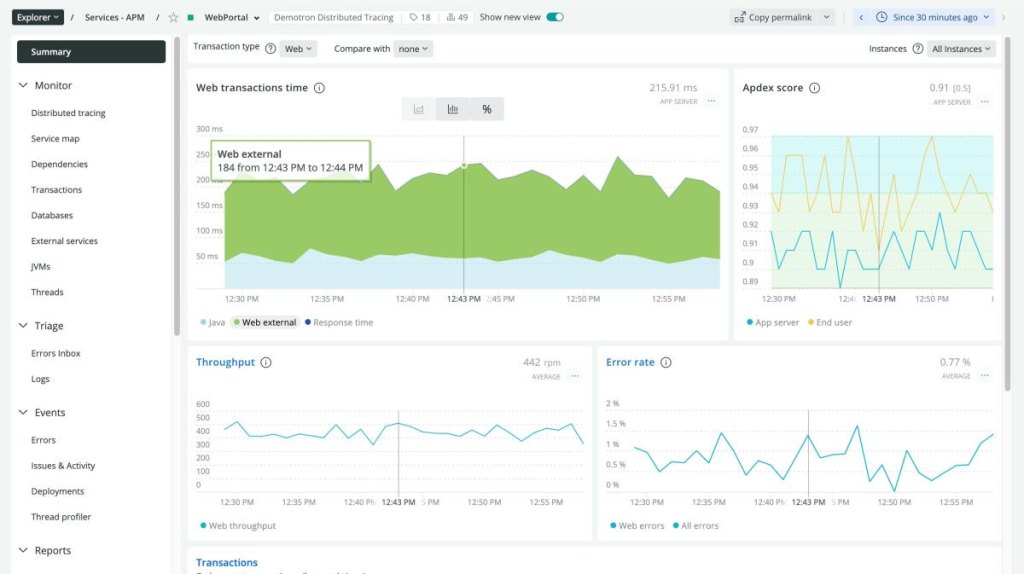
New Relic
New Relic is a software company that provides real-time performance management for web applications. They provide a free service for 15 days which will allow you to run your application on their cloud platform. Once the trial is over, you can purchase a subscription which is $20 per month. New Relic has a very user-friendly interface which allows you to easily see the performance of your application in real time.
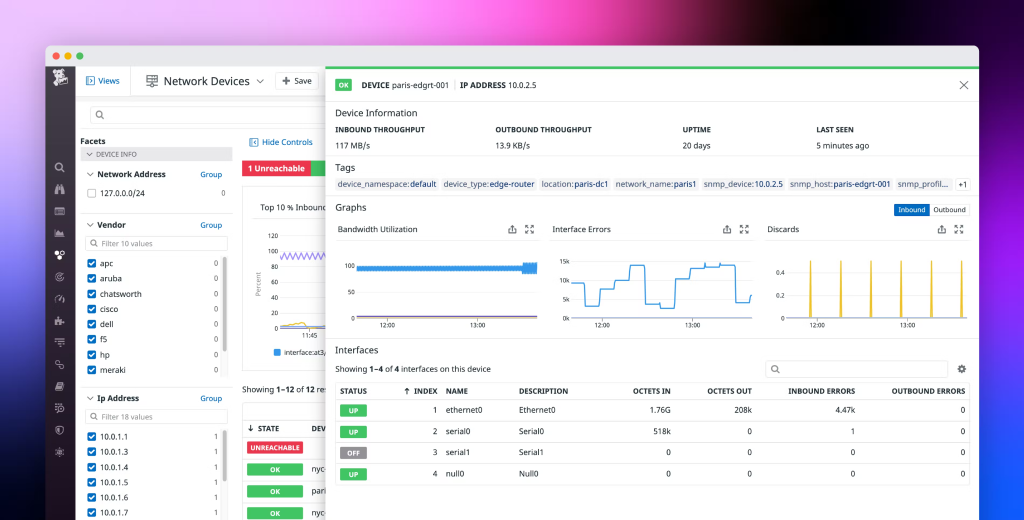
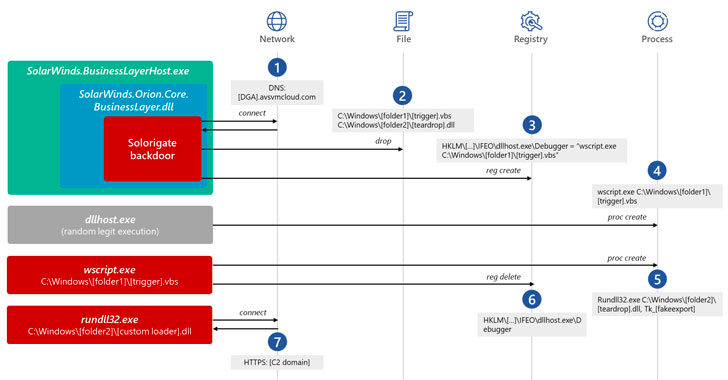
SolarWinds Server & Application Monitor
The SolarWinds Server & Application Monitor is a software application that monitors your computer and its applications. It can monitor your computer for crashes, as well as for changes in network activity. It can monitor your applications for performance and availability. With the SolarWinds Server & Application Monitor, you can easily monitor your servers and applications remotely, giving you peace of mind that they are running smoothly and efficiently.
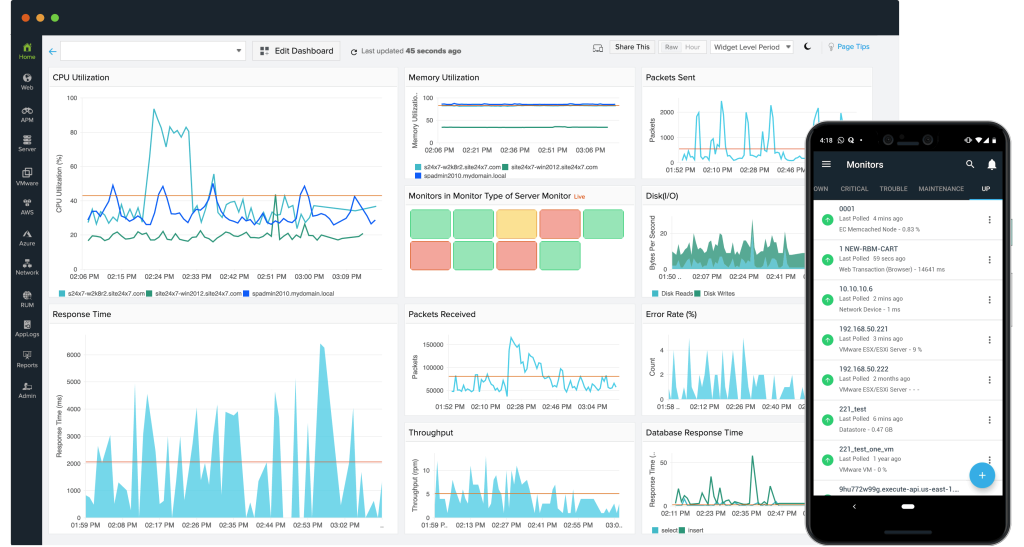
Site24x7 Application Performance Monitoring
Site24x7 is a web-based monitoring application that can help you keep tabs on the status of your websites. Site24x7 uses easy-to-understand graphs and charts to give you a clear view of your website’s performance. This application is very helpful for webmasters and those who are not familiar with the ins and outs of website performance. It also allows you to compare one website’s performance with another to see how it is doing in comparison. Site24x7 has over 50,000 users, so it is a very popular application.
Real-Time Communication Tools For SRES
In the past, communication was only possible in a one-way fashion; this meant that when an incident happened, it would be up to the SRE to gather as much information as possible. Nowadays, with the advent of real-time communication tools such as Zoom and Slack, more information can be gathered in real time. This means that more data can be collected and analyzed which can help provide better situational awareness.
Slack
Slack is a great tool for communication between your team members and also as a programmatic platform that can help automate responses and coordinate events. Slack is often used for internal communications in companies because of its ease of use and flexibility. Slack’s web interface allows you to send messages to a group or to a specific user, so it’s easy to communicate with multiple people at once. The Slack API allows you to automate actions that were previously done manually, and this makes Slack a great tool for chatops.
Telegram
Telegram is a messaging application that was designed for ease-of-use and efficiency. Users can send texts, images, videos and audio files, as well as voice messages, in private messages or public channels. This makes Telegram an effective option for any SRE team that needs a way to communicate efficiently and quickly.

Microsoft Teams
Microsoft Teams is a chat and video conferencing platform that helps you communicate with colleagues and customers. It is often used for planning, meetings, and collaboration. Microsoft Teams is available on-premises or in the cloud. SREs are in charge of IT infrastructure, applications, and services for the company. They need to collaborate with other IT teams, such as DevOps and Quality Assurance, to maintain the stability of their systems. Microsoft Teams is a useful tool for SREs because it allows them to easily communicate with their teams and customers using voice, text, or video chat.
Automated incident response software
Site reliability engineering is the process of identifying, analyzing, and mitigating the causes of service interruptions. Automated incident response software is a tool that helps identify when the system is having issues, allowing for fast and efficient resolution. The software works by monitoring your site for signs of problems, then automatically triggering responses that can help improve system stability. For example, if a server is having issues with high CPU usage, the software will notify you of the issue and trigger a response such as automatically restarting the server or shutting it down to avoid overloading the system.
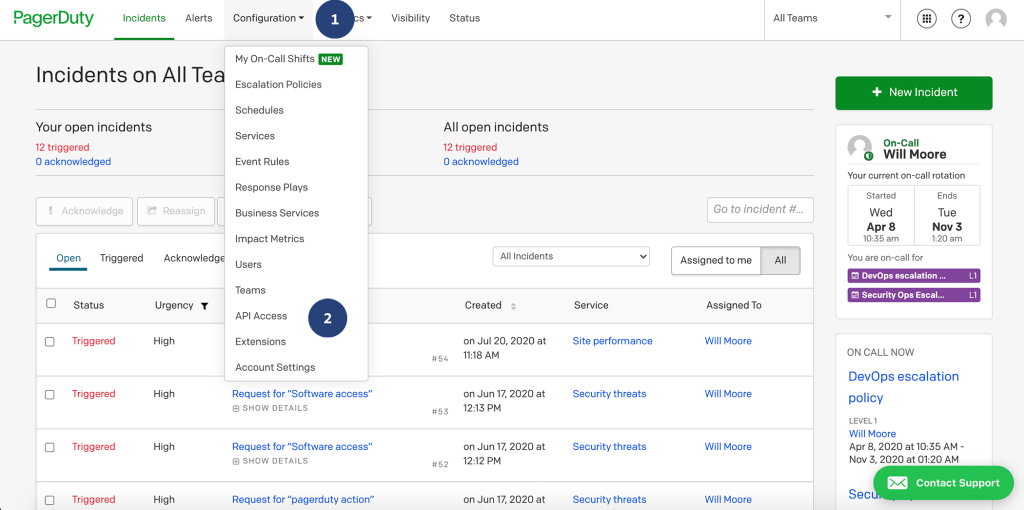
PagerDuty
PagerDuty is a tool for alerting your team about events and incidents that need attention. It is used by over 12,000 organizations including companies such as Microsoft, Cisco, and Yahoo!. PagerDuty lets you build and manage a team of people and assign them tasks to handle different types of events. If you are looking for a way to manage events and incidents, PagerDuty is an excellent option.
Victorops
Victorops is an incident management software that can help organizations reduce their response time to incidents. For example, Victorops can help an organization manage the time it takes to get a team on the scene of an incident by automatically sending out notifications and assigning tasks to staff members. By utilizing Victorops, an organization can be more efficient and reactive to incidents.
Opsgenie
Opsgenie incident management software provides an automated incident management solution that lets you view and manage incidents from anywhere, at any time. With Opsgenie, you can have a continuous view of your incidents, their statuses, and the progress of your teams. The software also provides a comprehensive reporting capability, so you can always keep tabs on the progress of your team’s work.
Squadcast
Squadcast is a free software tool for managing incidents. Squadcast is designed to be used by teams of engineers who handle incidents and their related information.
It features a dashboard that shows a summary of the current state of the incident. It also includes a detailed timeline of the incident’s progression and a set of dashboards that provide insight into the status and progress of the incident. Squadcast uses a set of REST APIs to communicate with the incident management system.
Xmatters
xmatters is a web application that enables you to keep track of all of the important metrics for your infrastructure. xmatters uses open source tools to provide real-time visibility into all of your systems, applications, and services. With xmatters, you can see the current status of your infrastructure, and also view trends over time. You can also set up alerts so that you know when your servers are overloaded, or when you have an outage.
Programming Languages
Python
Python is a powerful, modern language that is often used by startups and established companies alike. It’s easy to learn and has an enormous community supporting it. Best of all, it is free and open source.
Golang
Golang (or Go) is an open-source programming language created by Google in 2009. It’s easy to learn, and if you know C or Java, it can also scale well.
The Go programming language is extremely fast since it is a compiled language. Golang is also the powerhouse behind other services that SREs use, like Docker, Terraform, and Kubernetes.
Compared to Python, Go is not as descriptive, and therefore programmers may need to write more lines of code to carry out a specific function than they would have had to using Python.
Ruby
Ruby is an open-source server-side programming language. It is similar to Python or Perl, and can be used for both client-server and web applications. Ruby is a dynamic programming language, so there aren’t hard-and-fast rules when it comes to building features.
While Ruby is an excellent language for beginners, when it comes to web development it’s often used in combination with a web framework, such as Ruby on Rails. Other popular web development languages, like HTML, JavaScript, and CSS (Cascading Style Sheets), don’t include any of the front-end and back-end services that make Rails so useful.
With the ability to be easily modified, it’s easy to see why it’s used across many industries and organizations, like Airbnb, Shopify, Github, and Fiverr.
Containers/Microservices
As containers become a crucial technology for allowing organizations to more quickly develop and release applications and scale them across different environments, there’s still a lot of work to be done to fully understand how these technologies should be used.
The most popular cloud-native platforms are Docker, Kubernetes, and Nomad. These platforms are the leading solutions for supporting modern applications in the evolving cloud native environment.
Docker
Docker containers are a popular open-source containerization solution that makes it possible for users to package and run applications in a variety of environments, without having to consider specific operating system requirements or other factors.
This flexibility, coupled with the ease of containers, makes applications portable and able to be updated continuously. It lends itself to continuous integration and delivery as well.
Kubernetes
With Kubernetes, you can control a number of different environments, such as Google Cloud Platform, Amazon Web Services (AWS), Azure, Digital Ocean, and more.
Kube is a must-know if you want to get ahead of the cloud game. Although this may seem remarkably familiar to Docker, Kubernetes is not a direct competitor to Docker, as Kubernetes can be used in addition with the Docker platform. Docker also has their own orchestration system, called Docker Swarm.
Kubernetes manages multiple containers at the same time, helping to improve applications by upgrading applications without interrupting service to users and also monitors the overall health of applications. It can also assist with load balancing, helping to ensure applications perform at scale, as well as providing support for authentication and security at the infrastructure level.
Nomad
Nomad is a container orchestration platform that is used for managing containers and services on different nodes. One of the differences between Nomad and Kubernetes is that Nomad is designed for the Unix operations system.
Compared to Kubernetes, Nomad is much simpler and is less dependent on other services. Kubernetes requires a lot of other services to provide functionality. Nomad does not require or rely on any external services.
Kubernetes is much more resource intensive, in terms of setup and configuration, than most companies have to manage. Companies like Cloudflare, Pandora, Roblox, and many others know all about Kubernetes.
Configuration Management
Configuration Management. Configuration management tools allow a site reliability engineer to manage, track, control, and most importantly, automate various tasks, such as software upgrades and patches, security, user management, and much more.
These tools are used by SREs to automate the various configuration tasks at scale. Let’s take a look at some of the most commonly used configuration tools, like Terraform, Ansible, and Chef.
Terraform
You’ve heard of Ansible? It’s an open-source tool that is considered a DevOps tool. It was originally developed at HashiCorp and can be used to manage your own infrastructure, as well as automate other operations, such as the deployment of software, code updates, provisioning of resources, and much more.
Terraform is used to provision, manage, and orchestrate infrastructure, whether it’s on-premises, in the cloud, or a combination of both. It’s more efficient than trying to do it manually. With multiple providers, Terraform can be configured to use multiple AWS accounts.
Amazon Web Services (AWS) provides the tools and services for companies to build and run their web presence. This includes things like running websites, managing content, building mobile apps, developing and testing websites and creating online stores.
Ansible
Terraform and Ansible are both open source solutions for building, managing and deploying infrastructure as code. They’re quite similar, but each does things differently. In most cases, Terraform works better, but you can use Ansible in certain situations.
For example, Ansible’s playbook instructions are based on YAML, but is written in Python language. It also provides for extensibility and handles a wide-range of roles and scripts. With Terraform, you use their own configuration language, called HCL.
A resource can be thought of as a physical thing that can be changed. For example, it can be changed from a file on a hard drive to a different file, or it can be changed from one process to another.
Resource management is the process of managing resources, which include hardware, software, and data. An environment that relies heavily on using resources, such as virtualization and cloud computing, is a resource-centric environment.
One of the best examples of immutability is Terraform. In cloud and/or hybrid environments, Terraform is focused on immutability, which may be a better choice for those environments.
Chef
Chef is an open-source configuration management tool that is similar to Ansible and Puppet. It supports multiple platforms like Windows, Ubuntu, Solaris, Linux, FreeBSD, and more.
This integration can work with cloud-based providers, such as Amazon, Google Cloud Platform, Azure, and others. However, unlike Ansible, it is built on the Ruby programming language, which makes it easy for developers and teams that are familiar with this language.
As with the other tools we have discussed, the goal of any of these tools is to eliminate as much manual labor as possible. The environments can get complex and even harder to manage everyday, which is why a tool like Chef can be a blessing to DevOps and SRE teams.
Monitoring & Analytics
Prometheus
There are dozens of tools on this list that can help you do something, but Prometheus like many of these tools is another open source tool that many sites use. It’s used with Kubernetes and has a lot of features and plugins it supports.
Prometheus is used to monitor and collect metrics about your infrastructure and applications. You’ll learn what it does, how it works, and how to use it. One of its major differences from other monitoring tools is that Prometheus stores its data in its own datastore instead of the traditional relational database.
Other tools use a separate database to pull monitoring data and metrics. However, Prometheus can integrate with an extensive list of other databases and third-party solutions.
Grafana
The best monitoring tools for sysadmins are those that have a high degree of customization and extensibility and can be easily integrated into other tools. Grafana does both.
Dashboards can be configured with the metrics that are most important. Datasources supported by Grafana include Prometheus, MySQL, Elasticsearch, SQL, AWS, and many more.
It’s easy to create a dashboard in Grafana to share with other team members, and it can be shared via a link or a quick screenshot.
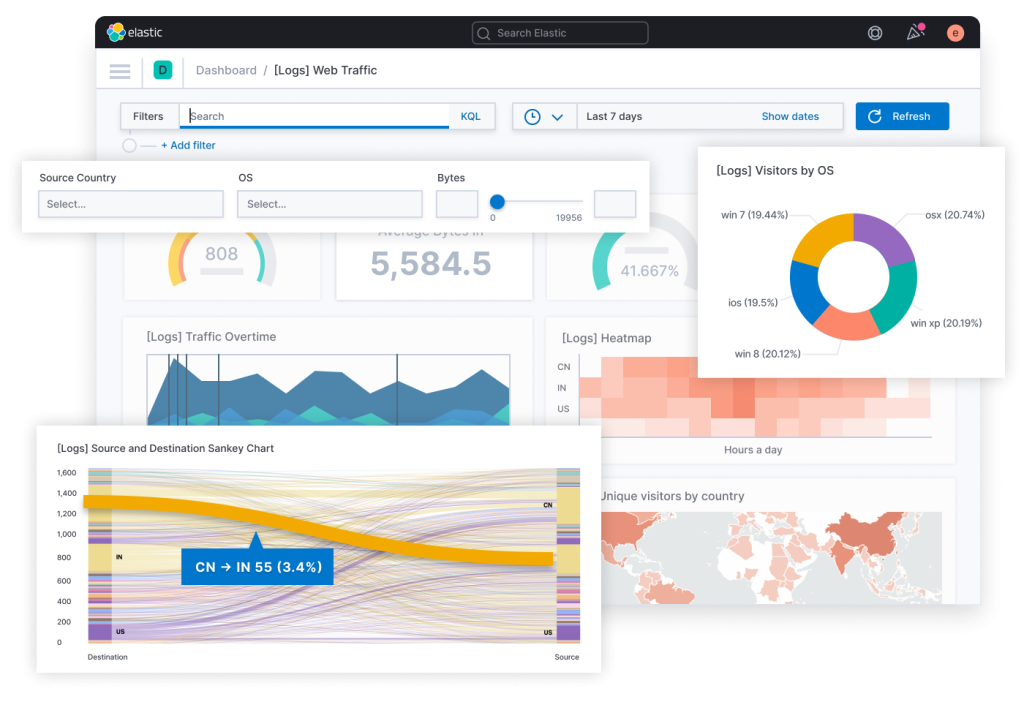
Kibana
Kibana is a visualization tool that is popular among SREs. It is free to use, but is proprietary to Elasticsearch, and works in conjunction with the Elastic Stack.
Kibana provides data analysis and visualization options that help to explore your data, visualize trends, share insights and gain actionable knowledge from it. These features are available both as standalone components and as part of a hosted Elasticsearch service.
Kibana integrates with several other services, including third-party integrations and is a strong user community for support.
Dotcom-Monitor
A comprehensive monitoring platform is vital for IT teams. It can be used to monitor websites, web applications, web services, and more.
Amazon’s platform provides you with the tools you need to set up and customize your own monitoring solutions. You can run various on-demand SLA and performance reports, view real-time dashboards, and even run your own performance tests to ensure that your whole stack performs optimally.
Dotcom-Monitor is not just a monitoring platform. It integrates with third-party communication platforms and alerting tools, like Azure, Slack, PagerDuty, VictorOps, and many more. See how Dotcom-Monitor compares to other monitoring platforms in the market, like Uptrends, Site24x7, Datadog, and others.